How to Read a Restaurant P&L? Expert Guide
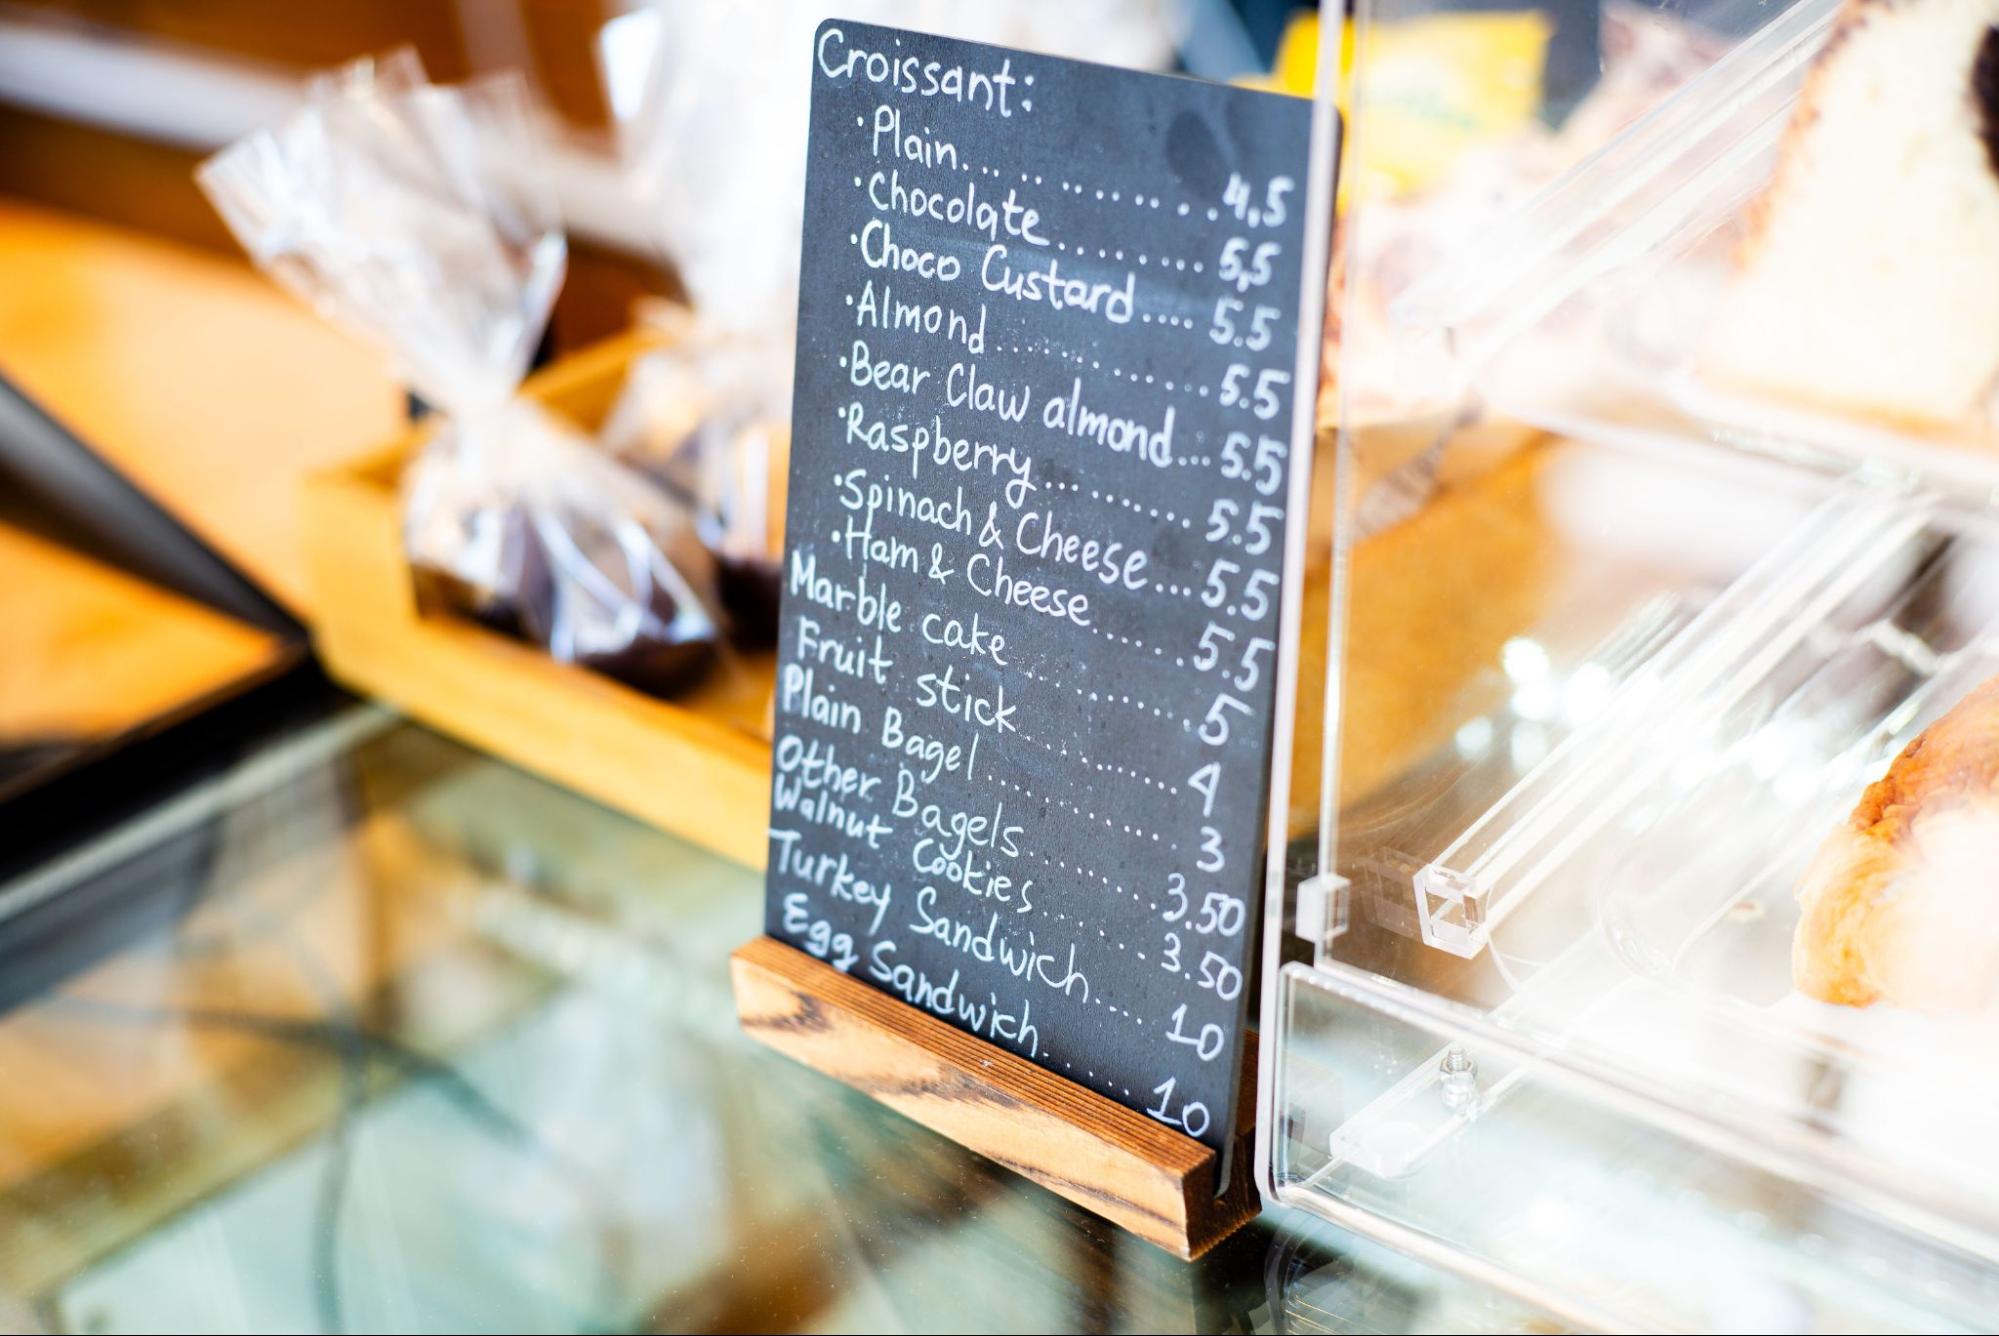
This guide explains how to read a restaurant P&L, understand the numbers that matter most, and use them to make smarter business decisions.
Running a successful restaurant takes more than serving great food. Every pricing decision, staffing choice, and operating cost affects your bottom line. Understanding your financial reports helps you spot problems early and make smarter decisions for long-term growth.
Did you know? Even busy restaurants can lose money without understanding their financial reports.
What Is a Restaurant P&L?
A restaurant Profit and Loss (P&L) statement is a financial report that summarizes your income, expenses, and profit over a specific period, usually weekly, monthly, or yearly.
Instead of only showing how much money came in, a P&L explains:
- How much revenue you generated
- What you spent on food and beverages
- Labor expenses
- Operating costs
- Your final profit or loss
Restaurant operators use P&Ls to identify financial problems before they become serious. Regular reviews help improve pricing, staffing, purchasing, and inventory decisions.
Why Reading Your Restaurant P&L Matters
Understanding your P&L helps you:
- Control food and labor costs
- Improve profit margins
- Make smarter purchasing decisions
- Identify waste and overspending
- Plan future budgets confidently
Many operators only check their bottom line. Successful restaurants review every major section because even small cost increases can significantly reduce profits.
Key Sections of a Restaurant P&L
The table below explains the main parts of a restaurant P&L and why each one matters.
How to Read Each Section
1. Revenue
Revenue appears at the top of your P&L.
Look beyond total sales by separating:
- Dine-in revenue
- Takeout sales
- Delivery income
- Catering
- Beverage sales
This breakdown helps identify which revenue streams are growing and which need improvement.
2. Cost of Goods Sold (COGS)
COGS includes everything required to prepare menu items.
Examples include:
- Food ingredients
- Beverages
- Packaging
- Condiments
If your COGS increases while sales stay the same, it could indicate:
- Food waste
- Portion control issues
- Rising supplier prices
- Inventory theft
Tracking COGS regularly allows operators to take corrective action quickly.
3. Gross Profit
Gross Profit is calculated as:
Revenue − Cost of Goods Sold
A higher gross profit means your menu generates more money before operating expenses.
Improving menu pricing and reducing food waste usually increases gross profit.
4. Labor Costs
Labor is often the largest controllable expense after food costs.
Include:
- Hourly wages
- Salaries
- Payroll taxes
- Employee benefits
- Overtime
Compare labor costs with sales.
If labor increases while customer traffic stays flat, scheduling may need adjustment.
5. Operating Expenses
These are the everyday costs of running your restaurant.
Examples include:
- Rent
- Utilities
- Insurance
- Equipment maintenance
- Cleaning supplies
- Marketing
- Software subscriptions
Review these expenses monthly to identify unnecessary spending.
6. Net Profit
Net Profit is your bottom line.
Formula:
Revenue − Total Expenses = Net Profit
A positive number means your restaurant earned money.
A negative number means you're operating at a loss.
The goal isn't simply increasing sales. It's increasing profitable sales.
Restaurant P&L Metrics You Should Monitor
Focus on these key performance indicators:
- Food Cost Percentage
- Labor Cost Percentage
- Prime Cost (Food + Labor)
- Gross Profit Margin
- Net Profit Margin
- Average Check Size
- Sales Growth
Tracking these metrics regularly helps you spot trends early and make informed financial decisions.
Common Mistakes When Reading a Restaurant P&L
Avoid these common mistakes:
- Looking only at total sales
- Ignoring weekly financial reports
- Missing rising labor costs
- Not comparing monthly trends
- Overlooking inventory waste
- Reacting too late to falling margins
Reviewing your P&L consistently makes it much easier to improve restaurant performance.
How AI Simplifies P&L Analysis
AI helps you understand your restaurant's financial data faster by highlighting important trends and unusual cost changes. Instead of reviewing spreadsheets manually, you get clear insights that support quicker decisions.
Turn Restaurant Data Into Better Decisions
Ready to simplify restaurant reporting?
Book a demo today and discover how AI-generated morning briefs transform complex data into clear, actionable insights that help your team improve operations and boost profits.
Frequently Asked Questions(FAQs)
1. What is a restaurant P&L?
A. A restaurant P&L summarizes revenue, expenses, and profit over a specific period, helping owners measure financial performance and improve decision making.
2. How often should I review my restaurant P&L?
A. Review your restaurant P&L weekly or monthly to identify trends, control expenses, and solve financial problems before they grow larger.
3. What is the most important number in a restaurant P&L?
A. Net profit is important, but monitoring food costs, labor costs, and prime costs provides better insight into long-term restaurant profitability.
4. Why can a busy restaurant still lose money?
A. High sales cannot offset excessive food waste, labor costs, or operating expenses, making profitability depend on effective financial management.
5. Can AI help analyze restaurant P&L reports?
A. Yes. AI identifies cost trends, highlights unusual spending, delivers daily operational insights, and supports faster, more informed business decisions.